
PAUL BUNYAN FEATURES
What Paul Bunyan records, and what it tells you
Paul Bunyan records every request on your WordPress site and turns the record into a ranked list of what to fix. Everything below is in the free edition unless marked Professional.
LOOK CLOSER
Which plugin is slowing down my site?
The Plugins screen shows what each plugin and theme costs per request: time to load, time to run, database queries and memory. It splits the cost by kind of request, so you can see that a plugin is cheap on the front end and expensive in the dashboard. You do not have to deactivate anything to find out.

START HERE
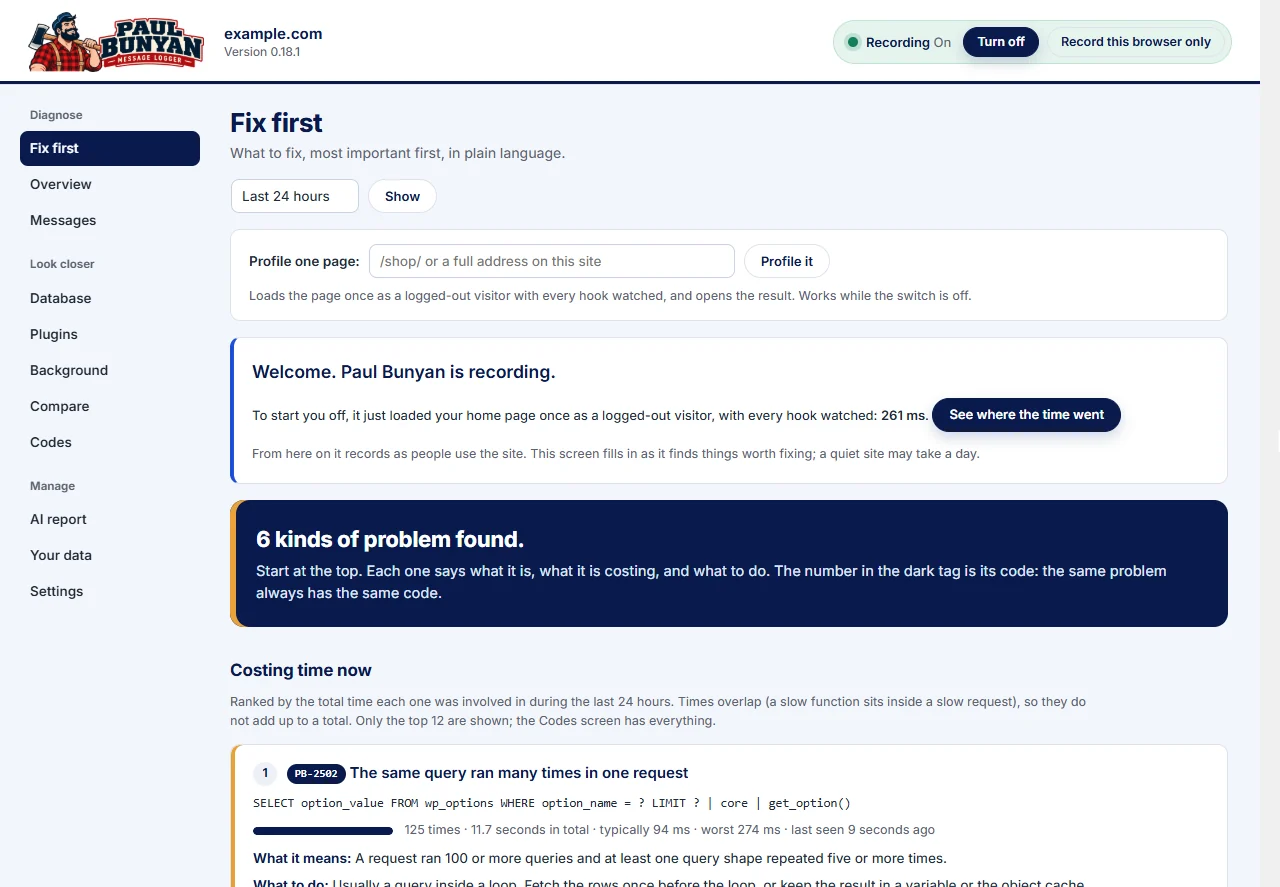
What should I fix first?
Fix first is the default screen. It is one list, ranked by total cost. Each row carries a numbered PB code, what the problem is, where it is, how often it happens, the time involved, what it means and what to do. It also checks the site’s setup: autoloaded data, object cache, scheduled jobs, debug settings and page caching.
LOOK CLOSER
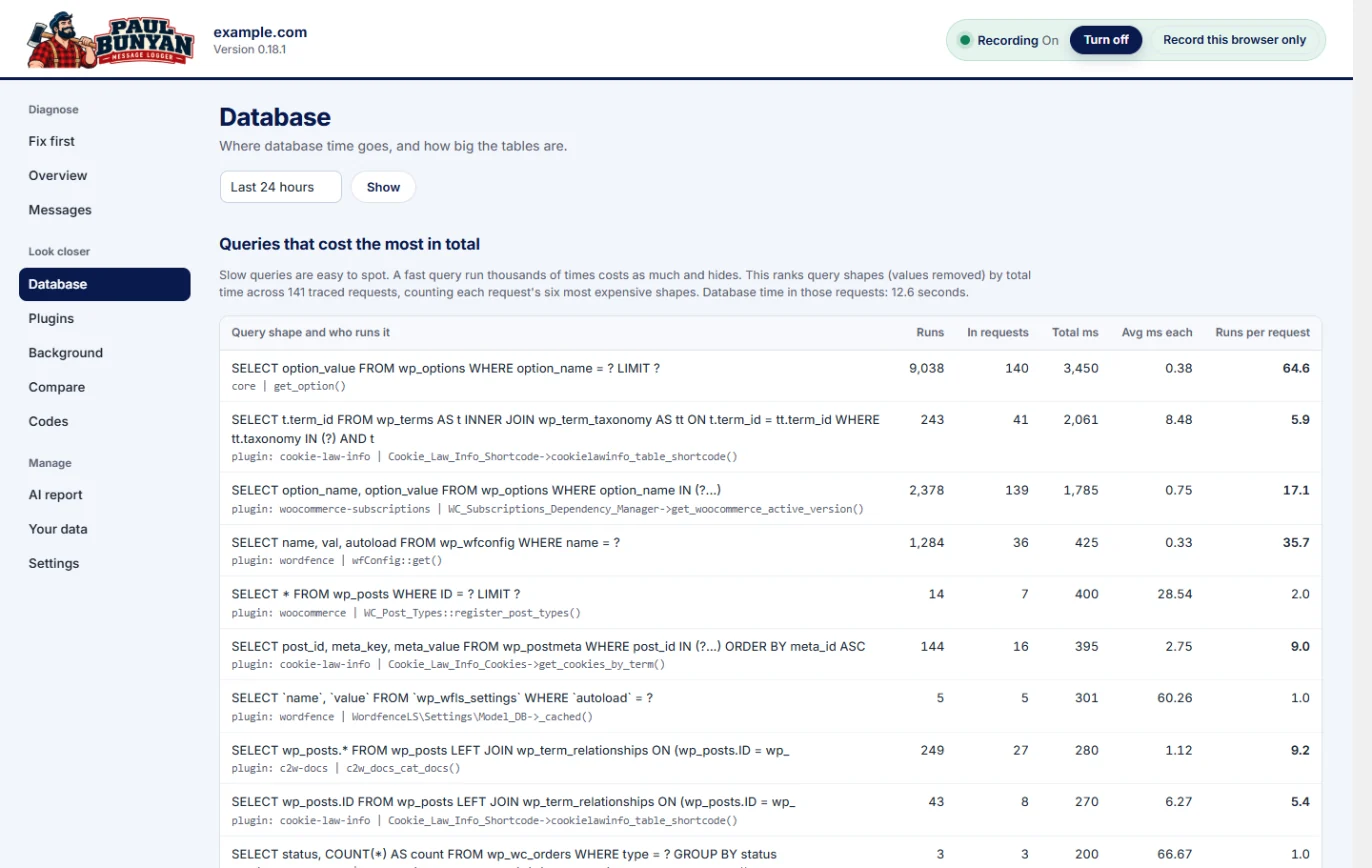
Where is the slow database query coming from?
The Database screen ranks query shapes by total time across all requests, not one page at a time. Each one names the plugin, file and line that ran it. It also lists your largest tables.
LOOK CLOSER
Why is checkout slow, and are emails part of it?
Each email is timed from the moment WordPress hands it over to the moment the mail server takes it. If an order confirmation adds a third of a second while the buyer waits, you will see it, with the code that sent it.

LOOK CLOSER
Did my scheduled jobs run, and how long did they take?
The Background screen lists WP-Cron and Action Scheduler jobs with their run times and failures. You can tell “cron is not firing” apart from “one job is failing and blocking the rest”.

LOOK CLOSER
How much processor time does a request use?
Paul Bunyan records processor time for every request, which is the figure a hosting CPU limit counts. When your host says you are over your limit, you can see which kind of request is using it.

LOOK CLOSER
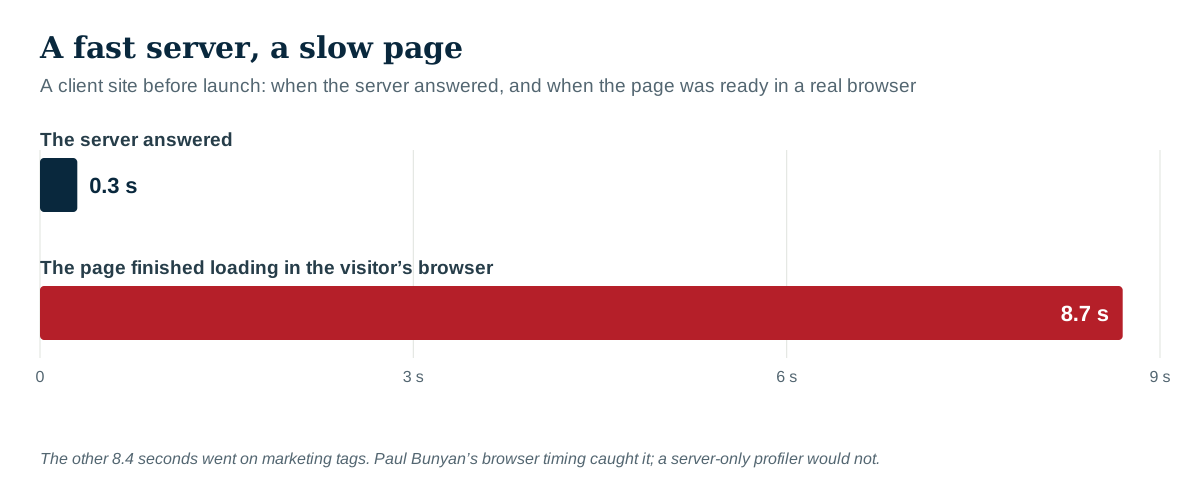
What do visitors experience in the browser?
A small script reports real page-load times from visitors’ browsers. A page can leave the server in 0.3 seconds and still take 8 seconds on screen; this is where you see the difference.
LOOK CLOSER
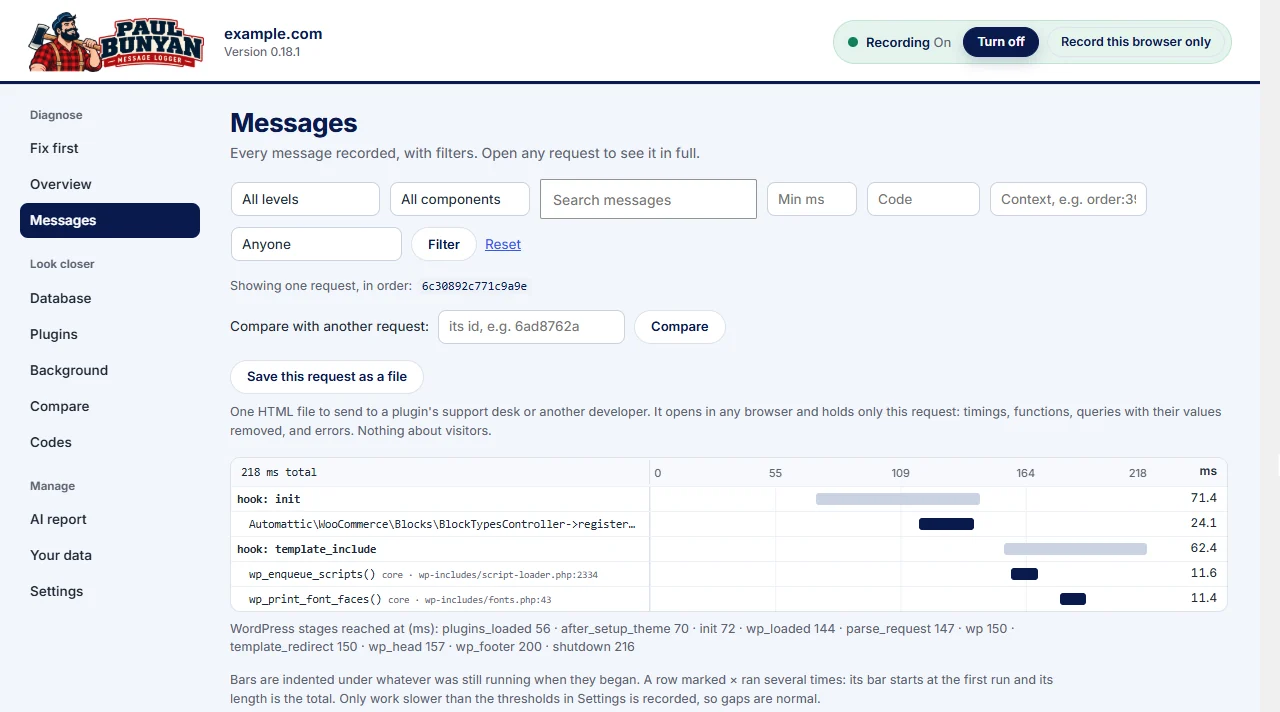
Can I see one request from start to finish?
The Messages screen opens any request as a timeline: WordPress stages, hooks, queries, outside calls, emails and your own log messages in order, with timings. Filter by level, component, text, minimum time or PB code.
LOOK CLOSER
Can I ask an AI about my site?
Yes, three ways. The AI report screen writes a summary of what Paul Bunyan found; copy it or download it and paste it into any AI assistant. On WordPress 6.9 and later, AI tools connected to your site can read the findings directly through four read-only abilities. And Professional adds Ask AI and “Explain this” buttons that use the AI service you choose, with your own key: Claude, ChatGPT, Gemini, or a model on your own computer. See The AI report and AI assistants.

LOOK CLOSER
Can I switch it off quickly?
One switch in the header and admin bar: on, off, on for 15 minutes to 24 hours, or on for your browser only. Off means off: nothing runs and nothing is written. There is a line for wp-config.php for when the dashboard will not load, and Paul Bunyan switches itself off if its own cost ever climbs (PB-1008). See Turn recording on and off.

LOOK CLOSER
Are my Core Web Vitals good?
Largest Contentful Paint, Interaction to Next Paint and Cumulative Layout Shift are measured per page from real visitors, with a code when one is poor (PB-2805, PB-2806, PB-2807). Time before the site answered shows when visitors wait on the network or for a free PHP worker before PHP even starts (PB-2808).

PROFESSIONAL
What Professional adds
- History of 30 days or 13 months
- Alerts by email or webhook
- “Got slower” detection after an update or a change
- Saved before-and-after markers
- WooCommerce order trails: one order followed across checkout, emails and background jobs
- Live site against staging, and requests running at the same moment
- Scheduled checks of chosen pages, and reports by email
- A read-only role for clients
- Ask AI and “Explain this”, with the AI service you choose
- Support tickets, answered within 1 business day
Professional is a separate add-on to the free plugin, from $59 a year. See pricing.

ALSO IN THE FREE EDITION
More it does.
Is an outside service holding up my pages?
Every call your site makes to another server is timed: license checks, payment gateways, shipping rates, APIs. Paul Bunyan shows which code made the call, how long it took and whether it failed. A slow dashboard is very often a plugin waiting on its own vendor’s server.
What PHP errors is my site throwing?
Errors, warnings and deprecation notices are grouped and counted, so 3,000 copies of one notice show as one line with a count. Each is tied to the plugin and file that raised it. Real errors do not get buried under noise.
Can I log from my own code?
Yes. Eleven functions cover it, from pb_info() to pb_scope() and pb_context(). For code that must run with or without the plugin, use do_action( 'paul_bunyan_log', ... ). See the developer reference.
What can’t Paul Bunyan see?
- Pages served from a page cache. The cache answers before WordPress starts, so there is no request to record. That is the cache doing its job. The Test page cache button tells you whether it is working.
- The browser’s own work beyond the timings it reports: rendering, fonts and third-party scripts. The browser’s developer tools are the place for those.
- Inside the server around WordPress: the web server and the database server’s own load. Paul Bunyan can tell you visitors waited before PHP started (PB-2808), but not which part of the host held them up.
- Code that never touches a WordPress hook, query or outside call. Wrap it in
pb_scope()to time it. See Time your own code.
The details worth knowing.
Does it work from the command line?
Yes: wp pb status, on, off, fix, report and log. See Paul Bunyan from the command line.
What other tools generally do not do
- Keep a record. Many debugging tools show the page you are looking at and forget it. Paul Bunyan keeps every request, including the ones no one was watching.
- Name the source. A slow query without an owner is half an answer. Paul Bunyan gives the plugin, file and line.
- Run on any host. Full tracing tools usually need a server extension or root access. Paul Bunyan is a plugin and nothing else.
- Say what to do. Raw timings are for developers. Fix first is written for the person who owns the site.
- Stay small. Tracing every function call can add hundreds of milliseconds. Paul Bunyan watches the places that matter and adds about 10 to 20 ms per request on our test sites.