
On this page
Paul Bunyan has one item in the WordPress admin menu. Inside it, a side menu groups the screens by task: Diagnose, Look closer and Manage, plus Professional when the add-on is installed. The header at the top shows whether Paul Bunyan is recording and holds the switch. Start with Fix first; the other screens are where you go for detail.
Diagnose
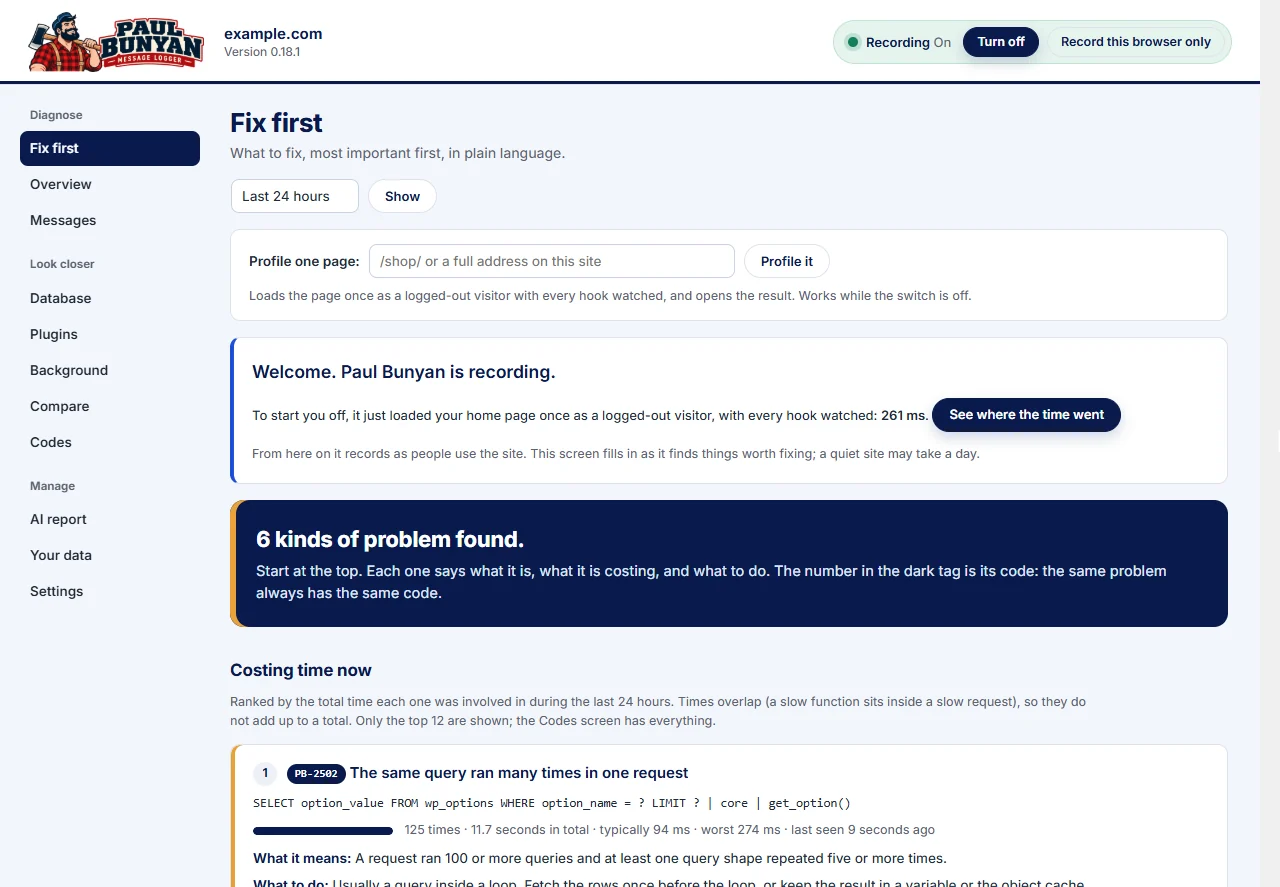
Fix first
One list of what costs your site the most, ranked by total time. Each row gives a PB code, what the problem is, where it is, how often it happened, the time involved, what it means and what to do. The bottom of the screen holds the site setup checks (PB-3001 to PB-3009) and a Test page cache button.
Overview
Where the time goes at a glance: request types ranked by total time, the slowest functions, processor time by request type, page loads and Core Web Vitals from real visitors' browsers, and what Paul Bunyan itself costs. Time before the site answered separates the wait before PHP started (network, connection, waiting for a free PHP worker) from the time PHP spent (PB-2808). Filter by visitor, logged-in user or administrator.

Messages
Every logged message, with filters for level, component, text, minimum time, PB code, context and kind of user. Click a request id to open that request as a timeline: WordPress stages, hooks, queries, outside calls, emails and your own log messages in order, with timings. From a request you can save it as a single HTML file to send to a plugin's support desk.
See these screens used on real sites: the custom WooCommerce case study follows Fix first, Plugins, Database and Messages to nine problems, and the ConferenceAxis launch review is built on Profile one page. More in the case studies.
Look closer
Database
Query shapes ranked by total time across all requests, with the plugin and function behind each. Slow queries say in words how the database ran them, including when a whole table was read (PB-2504). The largest tables are listed, and each large autoloaded option is matched to the plugin or theme that owns it, with a flag when that owner is no longer active.
Plugins
What each plugin and the theme cost per request: time to load, time to run, queries and memory, split by front end, dashboard, AJAX and background work.

Background
WP-Cron jobs and Action Scheduler actions: how often each ran, how long it took, how often it failed, and scheduled jobs with nothing attached to them. Action Scheduler work is also shown by plugin: waiting, late, failed and done.
Compare
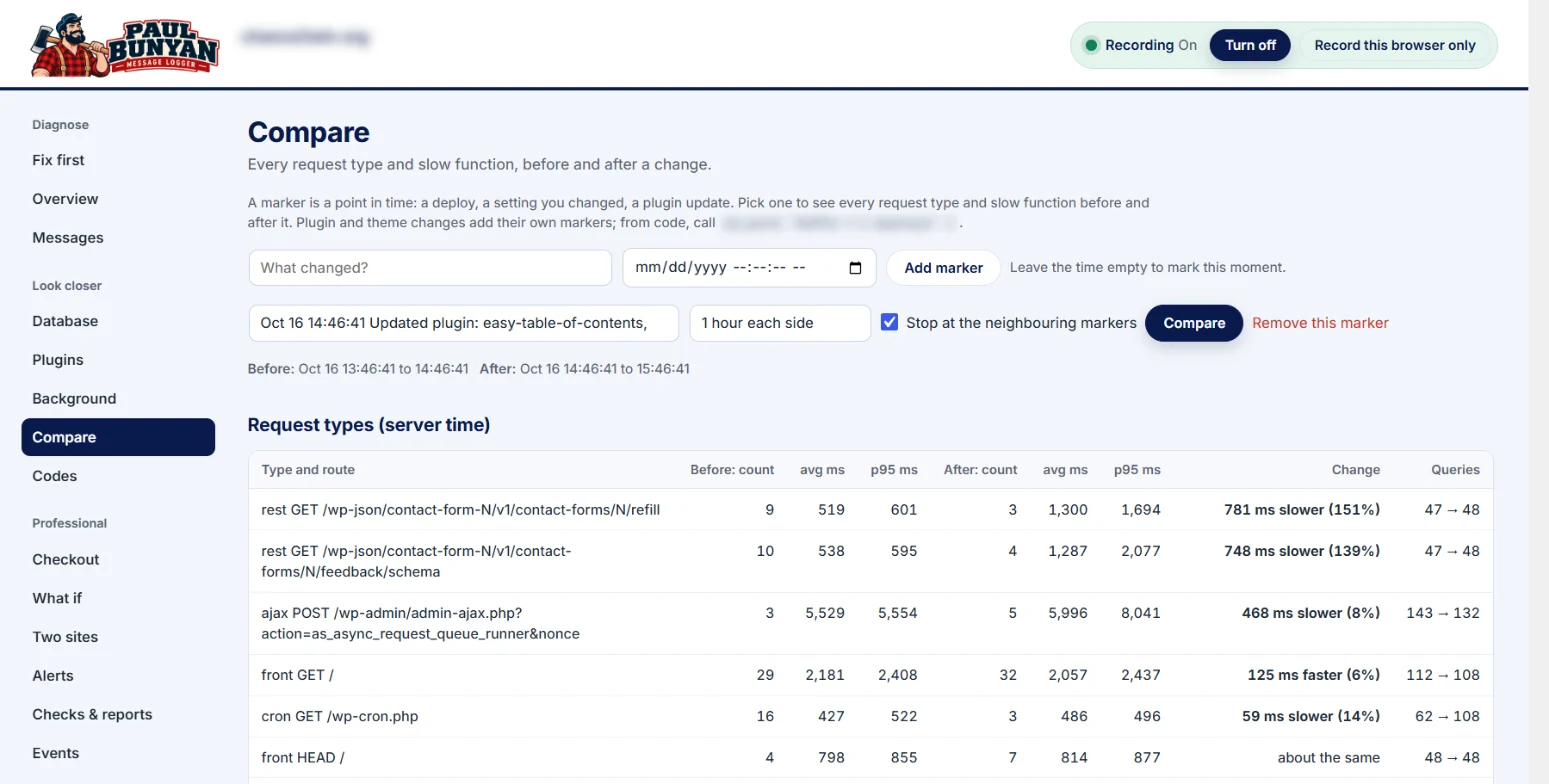
Compare two requests side by side, or pick a marker, such as a deploy, a setting change or a plugin update, and see every request type and function before and after it. Plugin and theme changes are marked automatically, and you can add your own markers from code with paul_bunyan_mark(). You can also profile one page on demand as a logged-out visitor, with every hook watched; this works even while recording is switched off.
Codes
Every PB code, what it means, what to do, how often it has come up on your site and when it was last seen. The same text is published in the PB code reference.
Manage
AI report
A plain-text summary of what Paul Bunyan found, written for an AI assistant. Copy it to the clipboard or download it, then paste it into any assistant you like. See The AI report and AI assistants.
Your data
What is stored and where, how much space it uses and how long it is kept. Download messages as CSV or JSON, carry your setup to another site, or delete. See Your data and privacy.
Settings
What is recorded, the thresholds for "slow", how much is traced, and the safety limit. See the settings reference.
Professional
With Paul Bunyan Professional installed, its screens appear in their own group: alerts, events and order trails, scheduled page checks, the two-site comparison, and the Professional screen with your license.
Broken links
Links to your own pages, and images and files from your media folder, that lead nowhere, with where each one is used and a suggested fix. Also lists links visitors followed to a missing page, and links that go through a redirect.
Read-only access
Administrators see every screen. With Professional, chosen roles can be given a read-only view: they see the findings, but the switch, the AI report, Your data, Compare and Settings stay with administrators.